One of the key activities in AMYPAD is the characterisation of amyloid beta (Aβ) in the brain over the course of different types of neurodegeneration and normal aging. Such characterisation is performed in a quantitative fashion through amyloid PET scans, preferably in the early parts of the neurodegenerative process.
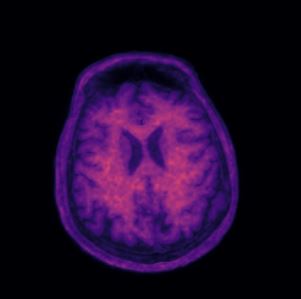
How are PET scans generated? PET scans are obtained by injecting the participant with a radio-labelled compound (PET tracer), which binds to amyloid plaques in the brain. The decaying radio-isotope of the compound emits positrons, which after annihilation in the surrounding tissue, emit a pair of high energy photons (gamma rays) each. It is the detection of such gamma pairs, stored in list-mode data in their millions, and which are key to forming 3D PET images. The images, which depict the distribution of the amyloid deposition in the brain, are formed by statistical inference using the acquired data (e.g., in list mode) and a complex 3D tomographic image reconstruction method. The key aspect of being able to count all the detected gamma pairs, together with the knowledge of the photon attenuation while traversing the human head, gives PET the edge in quantifying the amyloid in all the brain regions.
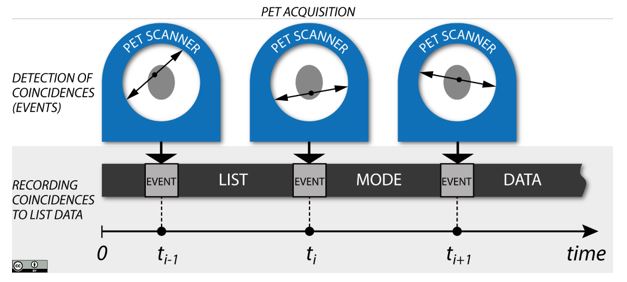
Detection of PET coincidences (events) and recording in the list-mode data (shown for three events at different time points of the acquisition).
Types of PET scans. The 3D PET images are formed by collecting gamma pairs (coincidences) detected by thousands of detectors over a chosen period of acquisition time. Preferably, PET scans should be acquired dynamically over at least one hour to account for the varying tracer kinetics (rates of reaction of the tracer with tissue types) and thus giving rise to accurate quantitative estimates of amyloid deposition throughout the brain. Usually, the tracer kinetics are captured by reconstructing the dynamic data into a series of 3D images, representing multiple time frames, usually less than 40.
The disadvantage of such dynamic PET scanning is the long acquisition time associated with higher cost. Hence, shorter and cheaper static scans of up to 20 minutes are often preferred in clinical practice and research. However, such scans offer limited quantitative accuracy compared to dynamic scans. Therefore, in AMYPAD, only a limited number of scans will be dynamic, with the majority of scans being static.
In addition, such dynamic or static PET scans can be acquired in multiple waves (time points) to measure the change in amyloid deposition over time in a single participant, leading to the so-called longitudinal PET scanning. Usually, such longitudinal scans are performed not more frequently than once a year in a single participant.
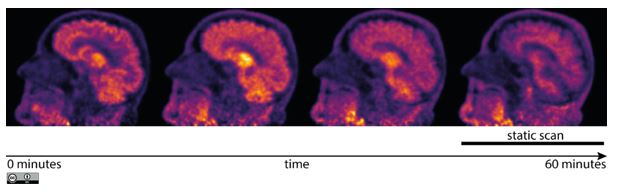
Change of the radio-distribution due to the tracer kinetics over one–hour acquisition
PET image analysis. Once the PET images are obtained, they are further processed to quantify amyloid deposition in cortical regions. This is done by relating the regions of interest (ROI), such as the anterior cingulate gyrus, or precuneus, to a reference region, which is generally spared by neurodegeneration (e.g., the cerebellum). Such regional quantification is facilitated by the structural images, like the T1 weighted MR, which are parcellated into a number of regions. Importantly, the T1w and PET images have to be in strict voxel-by-voxel correspondence, in order to propagate ROIs into PET accurately.
Challenges in image analysis and quantification. One of the biggest challenges in such analysis is the PET measurement noise and limited image resolution. Furthermore, accurate quantification strongly relies on precise propagating of the T1w-derived regions into PET. However, the presence of noise in PET and the limited resolution makes the rigid transformation between T1w and PET images subject to small but significant deviations and errors, particularly in short and noisy dynamic PET time frames.
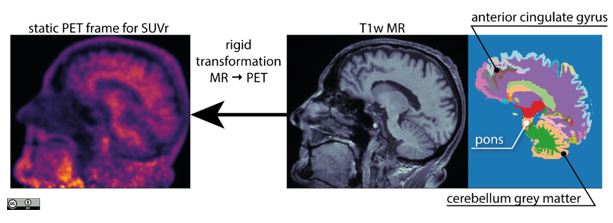
Propagation of T1w-derived regions of interest into PET image for accurate quantitative analysis
The limited PET resolution causes that a signal from one region is ‘spilt’ to another neighbouring regions. This effect of spilling in and out of brain regions is called the partial volume effect. To correct for it, a special algorithm, called partial volume correction (PVC) is applied to the PET images. However, the PVC algorithm depends on a good quality regional parcellations and their accurate alignment with the PET image, as well as a good estimate of the point spread function (PSF), which defines the amount of blurring by the imaging system.
It is clear that such MR-driven PET quantitative analysis relies heavily on precise propagation of T1w-based ROI into PET space. This propagation, through rigid transformation is, however, dependent on the head motion of the participant (more likely in dynamic scans) as well as on the noise in PET images.
All the above–mentioned aspects of image generation, processing and analysis can be performed using NiftyPET software, described in more details at https://niftypet.readthedocs.io. The key routines of the software are written in CUDA C for the use with graphical processing units (GPU) for fast and high-throughput image reconstruction and analysis of large datasets (thousands of PET images). All the functionality is available for the user in Python, so that the whole imaging pipeline can be adopted to any particular imaging scenario with different tracers and scanning protocols.
This software suite for PET analysis is partly sponsored by AMYPAD and is being developed by Pawel Markiewicz at UCL, in collaboration with AMYPAD partners, such as VUmc (Amsterdam), the University of Edinburgh and Barcelonabeta Brain Research Center.